
Predicting The Peak
A month or two ago I started modelling the reproduction number of COVID-19 using the R0 package. I then used this model to create a Shiny app to break down the data by country. Can we use this information to predict the peak in the UK?
Much of what follows is adapted from my original expirements with R0.
We’ll use the R0, tidyverse and lubdridate packages. In addition the knitr and xtable packages will come in handy for summary tables:
library(tidyverse)
library(lubridate)
library(R0)
library(knitr)
library(xtable)
Let’s load the data and filter by the UK:
confirmed <- read.csv(url("https://raw.githubusercontent.com/CSSEGISandData/2019-nCoV/master/csse_covid_19_data/csse_covid_19_time_series/time_series_covid19_confirmed_global.csv"))
confirmed <- subset(confirmed, select = -c(Lat, Long))

ukConfirmed <- confirmed %>%
        filter(Country.Region == "United Kingdom")
We now process the data to get the daily counts:
sums <- colSums(ukConfirmed[,-match(c("Province.State", "Country.Region"), names(ukConfirmed))], na.rm=TRUE)
sumsByDateCode <- as.data.frame(t(t(sums)))
colnames(sumsByDateCode) <- c("count")
sumsByDateCode$datecode <- rownames(sumsByDateCode)
dailyCounts <-mutate(sumsByDateCode, date = mdy(substring(datecode, 2)))
dailyCounts$day <- seq.int(nrow(dailyCounts))
dailyCounts <- dailyCounts %>%
  filter(count > 0)
In order to turn this into some kind of snapshot for this article let’s only keep the first 79 days worth of data (which corresponds to the 9th of April):
dailyCounts <- dailyCounts %>%
  filter(day <= 79)
For our model let’s use a mean generation time of 5 with a standard deviation of 1.9, as per this paper.
mgt <- generation.time("gamma", c(5, 1.9))We can now estimate the reproduction number over time using R0’s estimate.R function and the “time dependendent” method:
est <- estimate.R(dailyCounts$count, methods=c("TD"), GT=mgt)We can now gather the results into two data frames, one for the cases and their predictions, and the other for the estimated R over time:
dailyCountAndPrediction <- merge(dailyCounts, est$estimates$TD$pred, by="row.names", sort=FALSE, all=TRUE)
    dailyCountAndPrediction <- dailyCountAndPrediction[-c(1)]
    names(dailyCountAndPrediction)[5] <- "TD"
    dailyCountAndPrediction <- dailyCountAndPrediction %>%
      mutate(countDiff = count - lag(count))

estimatedR <- est$estimates$TD$R[1:length(est$estimates$TD$R)-1]
    estDf <- as.data.frame(estimatedR)
    colnames(estDf) <- c("R")
    estDf$day <- as.numeric(rownames(estDf))
Here’s the daily increase:
barplot(dailyCountAndPrediction$countDiff ~ dailyCountAndPrediction$day, xlab="days", ylab="difference", main="Daily Increase")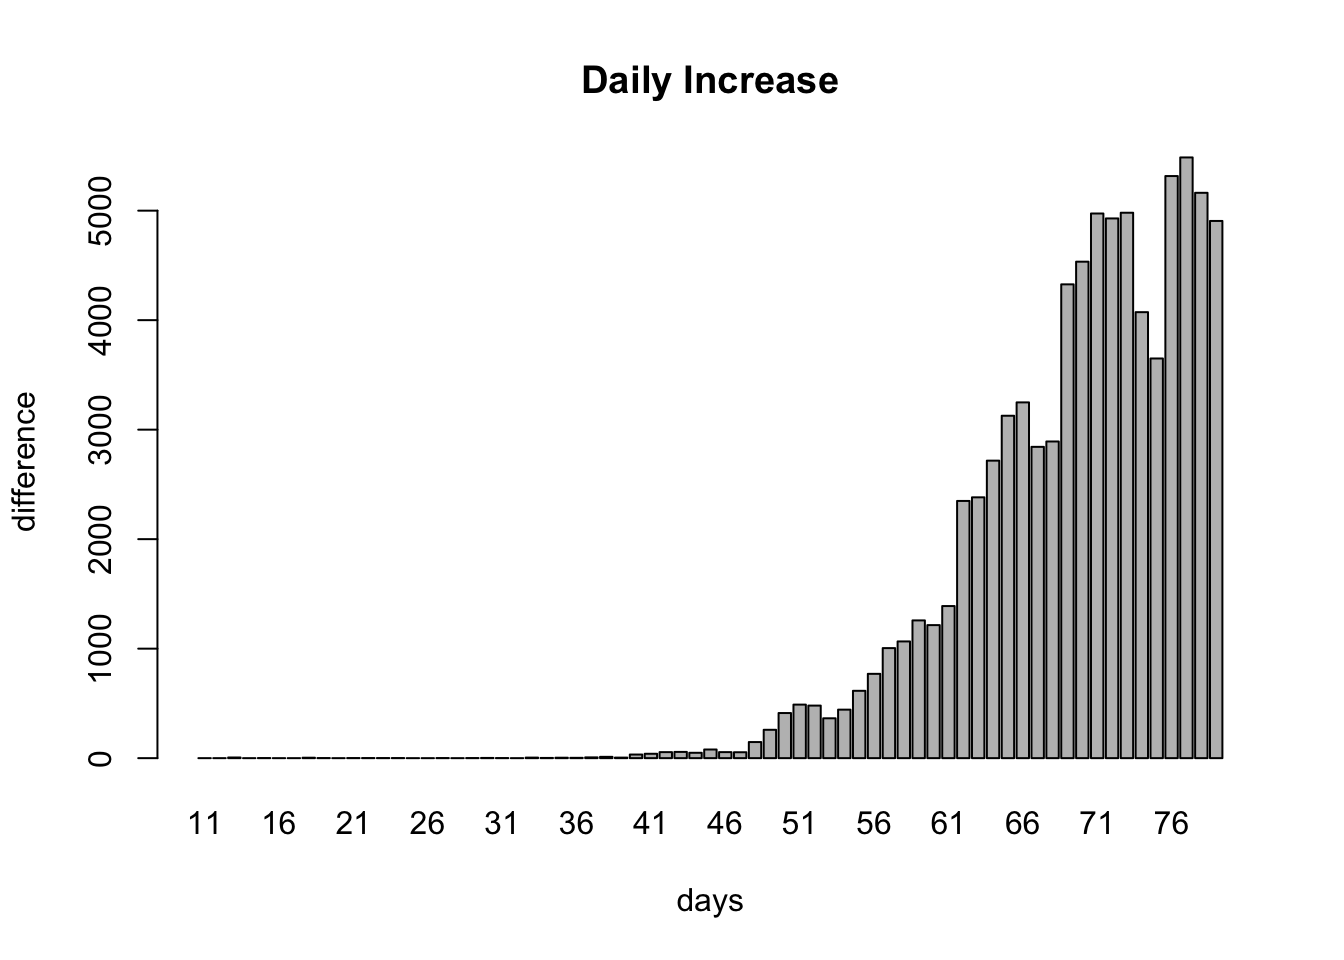
Have we peaked yet? It’s not clear. Let’s look at effective R. This value is greater than 1 before the peak and less than 1 after the peak. Here’s our estimate of R over time:
plot(estDf$day, estDf$R, xlab="days", ylab="R", ylim=c(0,20), pch=3, main="Effective R")
            abline(h=1, col="gray60")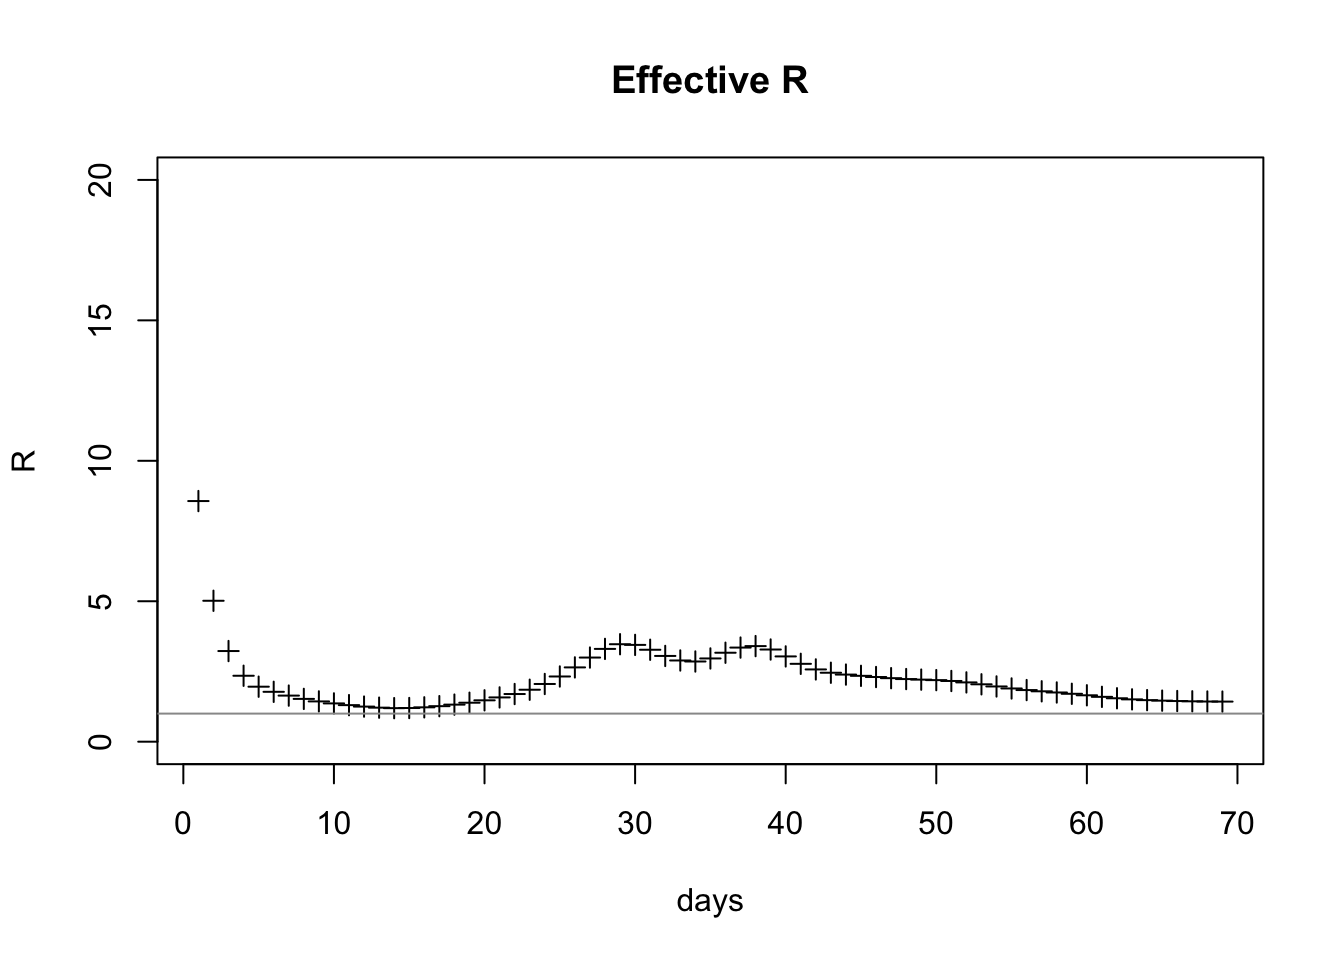
At the time this snapshot was taken it’s 1.4274474 which is still above 1.
So, when will the estimated R line cross the 1 line? Now the tail of the graph looks pretty linear, so let’s try a linear fit on the last 10 days:
last10Days <- tail(estDf, n=10)
fit  <- lm(R ~ day, data=last10Days)
plot(last10Days$day, last10Days$R, xlab="days", ylab="R", ylim=c(0,20), pch=3, main="Effective R")
            abline(h=1, col="gray60")
lines(last10Days$day, predict(fit, last10Days), col="red") 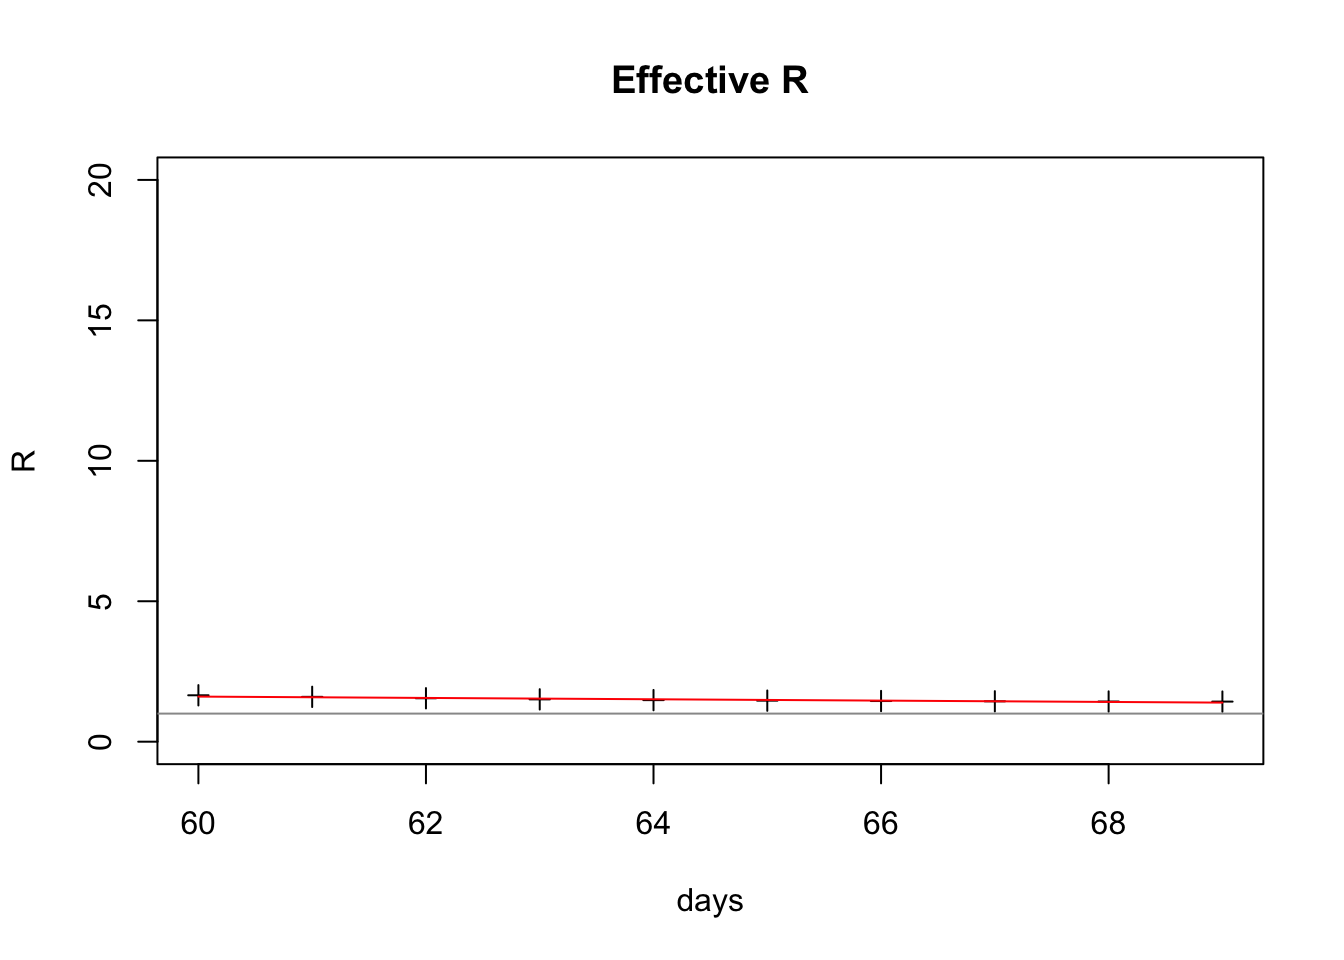
Here’s what the fit looks like:
| Estimate | Std. Error | t value | Pr(>|t|) | |
|---|---|---|---|---|
| (Intercept) | 3.0336514 | 0.2047949 | 14.813121 | 4.0e-07 |
| day | -0.0238024 | 0.0031720 | -7.503969 | 6.9e-05 |
From this we can estimate that R will reach the value of 1:
intercept <- summary(fit)$coefficients[1,1]
slope <- summary(fit)$coefficients[2,1]
(1 - intercept)/slope
## [1] 85.43903So about 12 days from the time of the snapshot, which would be roughly Wednesday 22nd April.
This is, of course, a very rough estimate based on several assumptions, particularly that the current measures keep the UK on its current trajectory. Also, it is assumed that the reporting of case numbers is accurate - given the scarcity of testing in the UK that is in some doubt, and even accurate numbers aren’t always reported in a timely fashion.
On top of that, this is under lockdown conditions. What happens when the lockdown is lifted?
