
Mapping COVID-19 In The UK
Let’s load some libraries:
library(tidyverse)
library(leaflet)
Tom White and others have provided an up to date set of data for UK COVID-19, including cases, tests and deaths. For the purposes of this article I’m interested in case counts only - the data file has rows of the following form:
raw_data <- read.csv("https://raw.githubusercontent.com/tomwhite/covid-19-uk-data/master/data/covid-19-cases-uk.csv")
colnames(raw_data)
## [1] "Date" "Country" "AreaCode" "Area" "TotalCases"Each row measures the number of cases in a particular area on a particular date. The TotlaCases are cumulative, that is to say that at any point in time we should use the most recent measurement for the area. As for what AreaCode means, see below.
Let’s load the data and do some minimal tidying - converting the date column to a Date type and only including records for which there are cases.
caseData <- raw_data %>%
  mutate(Date = as.Date(Date)) %>%
  mutate(TotalCases = as.integer(TotalCases)) %>%
  filter(TotalCases > 0)
head(caseData)
## Date Country AreaCode Area TotalCases
## 1 2020-01-22 Wales W11000030 Cwm Taf 1
## 2 2020-01-23 Wales W11000030 Cwm Taf 1
## 3 2020-01-24 Wales W11000030 Cwm Taf 1
## 4 2020-01-25 Wales W11000030 Cwm Taf 1
## 5 2020-01-26 Wales W11000030 Cwm Taf 1
## 6 2020-01-27 Wales W11000028 Aneurin Bevan 1We are interested in the distribution of cases by space rather than time, so let’s remove all but the most recent case numbers fo each area:
latestData <- caseData %>%
  group_by(AreaCode) %>%
  slice(which.max(Date))
head(latestData)
## # A tibble: 6 x 5
## # Groups: AreaCode [6]
## Date Country AreaCode Area TotalCases
## <date> <fct> <fct> <fct> <int>
## 1 2020-05-06 Northern Ireland "" Not Known 315
## 2 2020-05-05 England "E06000001" Hartlepool 216
## 3 2020-05-05 England "E06000002" Middlesbrough 589
## 4 2020-05-05 England "E06000003" Redcar and Cleveland 337
## 5 2020-05-05 England "E06000004" Stockton-on-Tees 380
## 6 2020-05-05 England "E06000005" Darlington 306Let’s plot the top 10 affected areas:
top10 <- latestData %>% ungroup() %>% top_n(10, TotalCases)

ggplot(top10, aes(x=reorder(Area, TotalCases), y=TotalCases))  + geom_col() +
    xlab("Area") +
coord_flip() 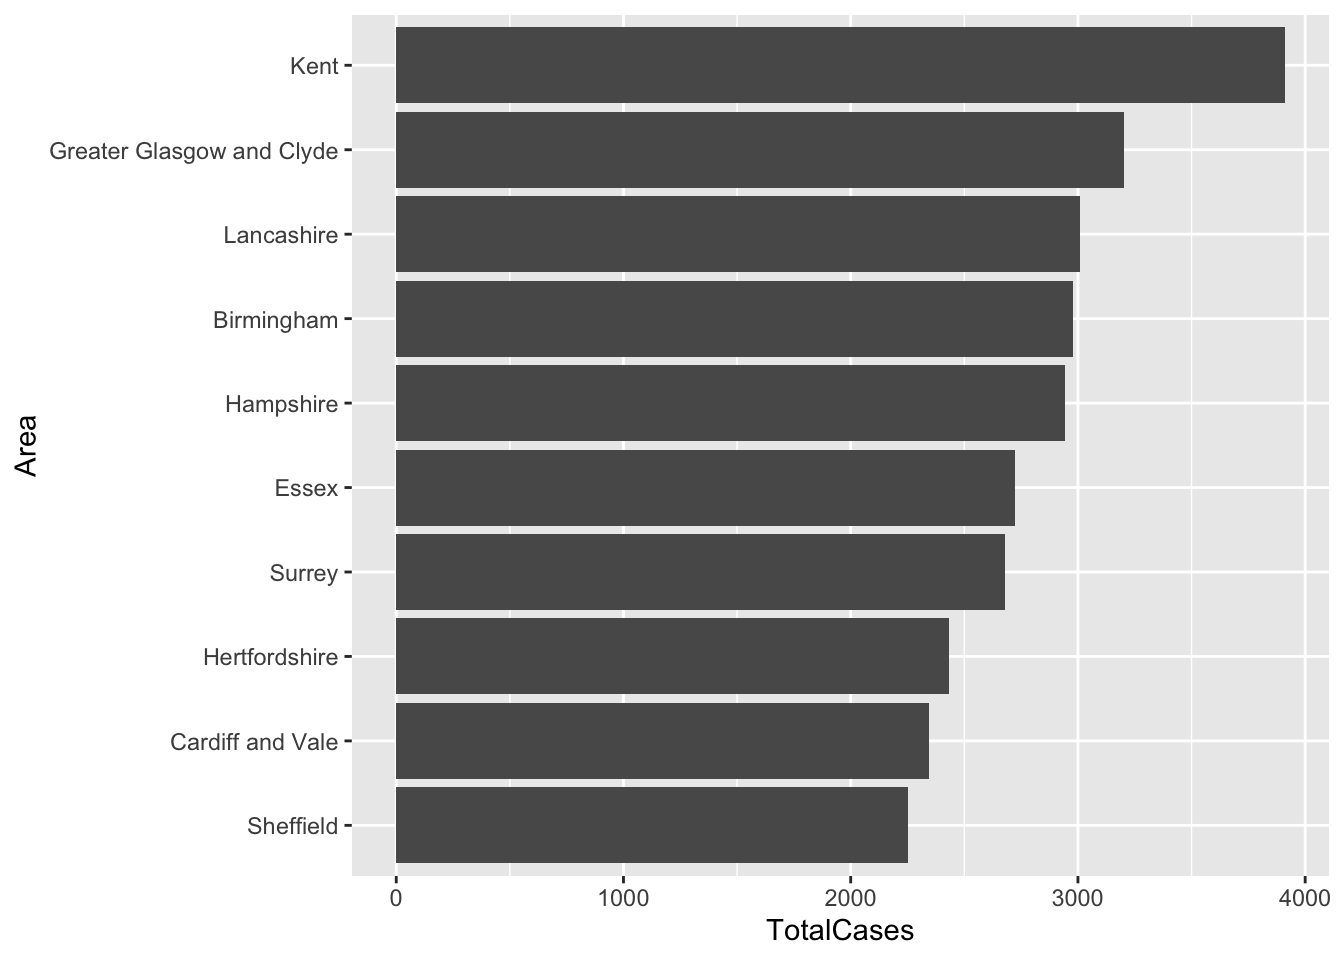
So Kent and, Glasgow and Hertfordshire are the hardest hit in England, Scotland and Wales respectively.
Now if we want to plot this on a map we need to know where these areas are - what their latitude and longitudes are. Unfortunately the AreaCode doesn’t specify exactly the same type of region across England & Northern Ireland, Wales and Scotland. There has been some discussion about this problem in the data repository, with various suggestions.
For England and Northern Ireland the AreaCode is the local authority code. We can get data for this using the ONS Geoportal. This contains all sorts of data about regions of all sorts within the UK, and their geographical data.
I would like to just query the coordinates for a given area code, or just retrive the coordinates for all codes, but the JSON API is a little unwieldy for this. It returns a tree structure of attributes and requires pagination handling. So instead I downloaded the data as CSV files and put them in S3.
Let’s get the England & NI data and put into a standard form that maps AreaCode to Latitude and Longitude:
englandNIData <- read.csv("https://extropy-datascience-public.s3-eu-west-1.amazonaws.com/data/ons/local-authorities/Local_Authority_Districts_(April_2019)_Boundaries_UK_BFE.csv") %>%
  mutate(AreaCode = LAD19CD) %>%
  mutate(Longitude = LONG) %>%
  mutate(Latitude = LAT) %>%
  select(c(AreaCode, Longitude, Latitude))
head(englandNIData)
## AreaCode Longitude Latitude
## 1 E06000001 -1.27023 54.6762
## 2 E06000002 -1.21099 54.5447
## 3 E06000003 -1.00611 54.5675
## 4 E06000004 -1.30669 54.5569
## 5 E06000005 -1.56835 54.5353
## 6 E06000006 -2.68853 53.3342In Wales the AreaCode appears to refer to the Primary Care Trust Code. The get the coordinates for these I used the Open Data Camden Wales Postcodes data set. Again, I’ve exported the data as CSV and placed into S3. We’ll put into the same standard form:
walesData <- read.csv("https://extropy-datascience-public.s3-eu-west-1.amazonaws.com/data/ons/local-authorities/Wales_Postcodes-120520.csv") %>%
  mutate(AreaCode=Primary.Care.Trust.Code) %>%
  select(c(AreaCode, Longitude, Latitude))
head(walesData)
## AreaCode Longitude Latitude
## 1 W11000029 -3.220650 51.47868
## 2 W11000028 -3.052668 51.67233
## 3 W11000025 -4.426676 51.90519
## 4 W11000024 -3.346645 52.34151
## 5 W11000030 -3.465047 51.61449
## 6 W11000023 -3.617987 53.13743I extracted this data with a kind of fudge - I grouped by Primary.Care.Trust.Code and took the average of Longitude and Latitude as a rollup.
Alas, for Scotland I have not been able to find the coordinates. The AreaCode here refers to Health Board Areas but I could find no mention of latitude and longitude for these entities on Statistics.Gov.Scot. So unfortunately I won’t be able to plot Scottish data at this time - a puzzle for another day.
Let’s make a combined data frame for all our coordinate data:
combinedGeoData <- bind_rows(englandNIData, walesData)Now that we have latitude and longitude (LAT and LONG above) let’s update our case data to include these coordinates:
mappedLatestData <- latestData %>%
  left_join(combinedGeoData)
Now we are in a position to create a map using Leaflet.
options(viewer = NULL)
map <- leaflet(mappedLatestData) %>%
  addTiles() %>%
  addCircles(lng = ~Longitude, lat = ~Latitude, weight = 10, radius = ~TotalCases * 10, popup = ~Area) %>%
  setView(lng = -2.89479, lat = 54.093409, zoom = 6)
map
This provides a simple way to visualise severity on a map. There are some other options or improvements, such as a Choropleth Map.
The main thing I’d want to fix first is adding Scotland’s data!
