
Back To School - Part 1
Like many other parents in the UK (and elsewhere) we are giving careful consideration to the re-opening of schools. Our children, aged 10 and 12, both go back next week. Our youngest attends a rural primary school with small class sizes and a small catchment area. Our oldest, on the other hand, attends a much larger secondary school with a wide catchment area. We have masks, thermometers, sanitizers, procedures all set but when should we worry? Should we worry now?
Community transmission has usually been low but a lot depends on preventative measures and authorities acting decisively. In Glasgow for example (where schools have already opened) an entire primary school class has been self-isolated. Without the proper measures in the right circumstances it can spread very quickly.
Previously I used this data set for UK COVID-19. This data has now been retired, but UK data is still being published here.
Can we use this data to determine hotspots and determine what schools may be affected?
The Data
The data consists of one row per date per location and reports both the cases on that date and cumulative cases so far in that location.
raw_data <- read_csv("https://coronavirus.data.gov.uk/downloads/csv/coronavirus-cases_latest.csv")
colnames(raw_data)
## [1] "Area name" "Area code"
## [3] "Area type" "Specimen date"
## [5] "Daily lab-confirmed cases" "Cumulative lab-confirmed cases"
## [7] "Cumulative lab-confirmed cases rate"head(raw_data)## # A tibble: 6 x 7
## `Area name` `Area code` `Area type` `Specimen date` `Daily lab-conf…
## <chr> <chr> <chr> <date> <dbl>
## 1 Adur E07000223 ltla 2020-09-04 0
## 2 Adur E07000223 ltla 2020-09-03 0
## 3 Adur E07000223 ltla 2020-09-02 1
## 4 Adur E07000223 ltla 2020-09-01 0
## 5 Adur E07000223 ltla 2020-08-31 0
## 6 Adur E07000223 ltla 2020-08-30 0
## # … with 2 more variables: `Cumulative lab-confirmed cases` <dbl>, `Cumulative
## # lab-confirmed cases rate` <dbl>The area type indicates what kind of regional division the area is - eg a local authority, or a nation. For full details check out the developer’s guide.
What’s the available date range?
min(raw_data$`Specimen date`)## [1] "2020-01-30"max(raw_data$`Specimen date`)## [1] "2020-09-04"Let’s take a look at “lower-tier local authority” data - the smallest region type, and tighten up the column names, and remove columns we aren’t interested in:
all_areas <- raw_data %>%
  mutate(area = `Area name`) %>%
  mutate(code = `Area code`) %>%
  mutate(date = ymd(`Specimen date`)) %>%
  mutate(cases = `Daily lab-confirmed cases`) %>%
  filter(`Area type` == 'ltla') %>%
  arrange(date) %>%
  dplyr::select(area, code, date, cases)
For an initial exploration we can pick a particular local authority area, Middlesbrough, which has area code E06000002 and take a look at cases over time.
area_cases <- all_areas %>%
  filter(code=='E06000002')

ggplot(area_cases) + aes(x=date, y=cases) + geom_line() + geom_smooth(method = "loess")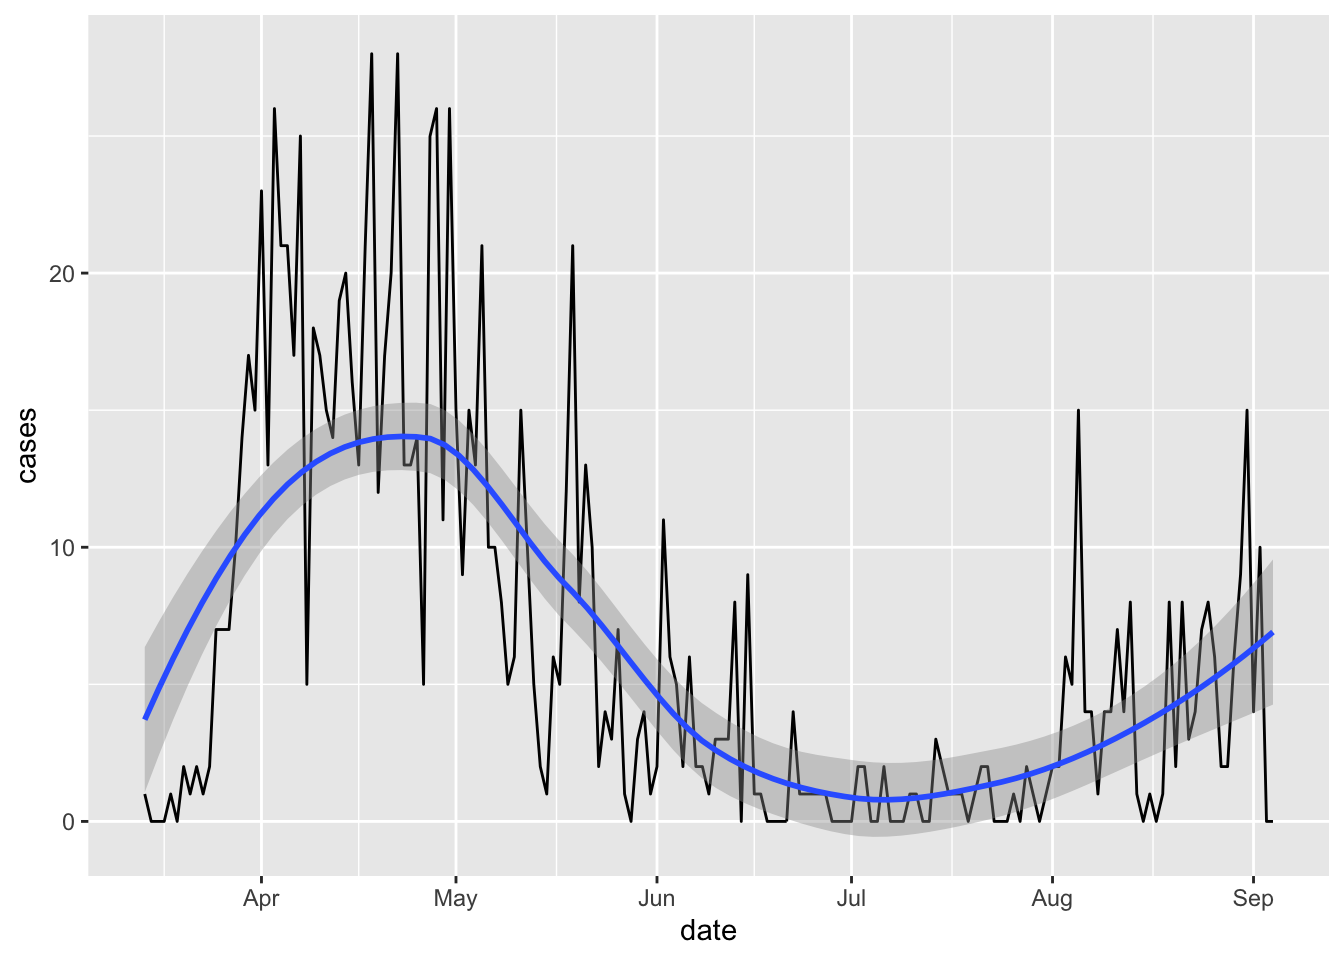
What does R look in Middlesbrough? Let’s take the 7 day rolling average and use the R0 package’s “time-dependent” calculation method:
meanGenerationTime <- generation.time("gamma", c(5, 1.9))
rollingAverageCases <- area_cases %>%
mutate(avg=rollmean(cases, 7, fill=NA, align="right")) %>%
filter(!is.na(avg))
epid <- structure(rollingAverageCases$avg, names=as.character(rollingAverageCases$date))
est <- estimate.R(epid=epid, end=max(rollingAverageCases$date), GT=meanGenerationTime, methods=c("TD"))
r <- est$estimates$TD$R
plottableR <- r[0:(length(r)-1)]
df <- data.frame(date=as.Date(names(plottableR)), r=plottableR)
ggplot(df) + aes(x=date, y=r) + geom_line() + geom_hline(yintercept = 1, col="red") + xlab("Date") + ylab("Effective R")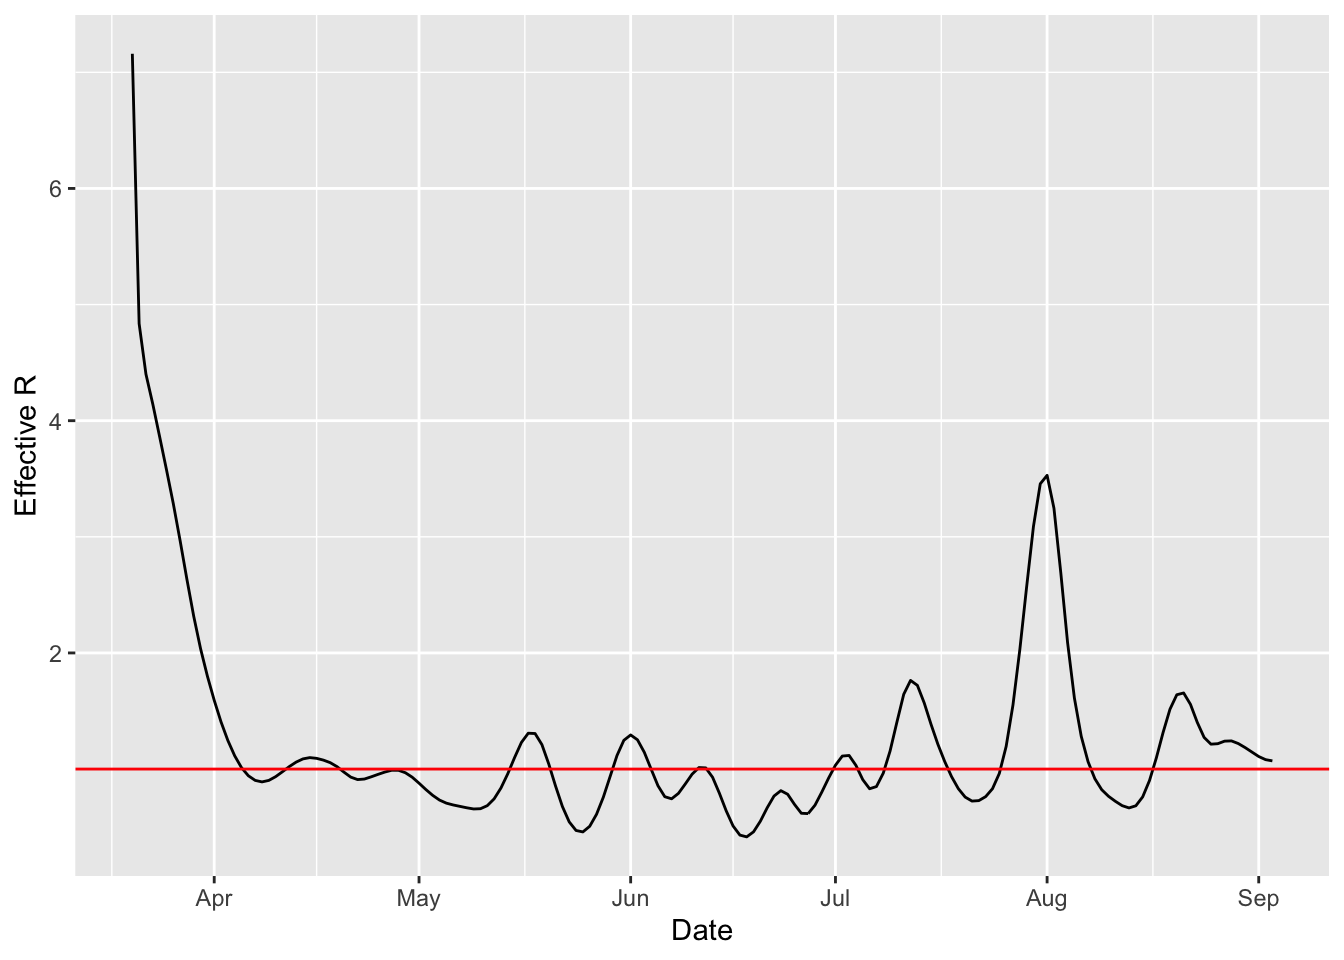 What’s the latest value of R?
last(plottableR)## [1] 1.070534In the next post we’ll put this on a map.
