
Using The R0 Package Correctly
I’ve just realised why my estimates of R do not tally with the established figures, especially after the peak. The reason is an absurdly simple case of user error, for which I can only apologise.
The R0 estimate.R function accepts an epidemic curve as its primary data. An epidemic curve is a time series of new cases over time. Unfortunately, I have been using the number of confirmed cases over time. This value only increases, so the value of R it calculates will never fall below 1 (although it may reach 1). This wasn’t that noticeable before the peak, but was definitely a problem after it.
Let’s plot estimated R for the UK again, only this time converting the confirmed case data into a time series of new cases.
library(tidyverse)
library(lubridate)
library(R0)
confirmed <- read.csv(url("https://raw.githubusercontent.com/CSSEGISandData/2019-nCoV/master/csse_covid_19_data/csse_covid_19_time_series/time_series_covid19_confirmed_global.csv"))
confirmed <- subset(confirmed, select = -c(Lat, Long))
ukConfirmed <- confirmed %>%
filter(Country.Region == "United Kingdom")
sums <- colSums(ukConfirmed[,-match(c("Province.State", "Country.Region"), names(ukConfirmed))], na.rm=TRUE)
sumsByDateCode <- as.data.frame(t(t(sums)))
colnames(sumsByDateCode) <- c("count")
dailyCounts <- sumsByDateCode %>%
mutate(day = row_number()) %>%
mutate(new_cases = count - lag(count, default=count[1])) %>%
filter(count > 0) %>%
filter(new_cases > 0)We’ll continue to use a generation time distribution with a mean of 5 days, standard deviation 1.9:
meanGenerationTime <- generation.time("gamma", c(5, 1.9))Let’s estimate R:
est <- estimate.R(dailyCounts$new_cases, end=length(dailyCounts$new_cases), methods=c("TD"), GT=meanGenerationTime)estimatedR <- est$estimates$TD$R[1:length(est$estimates$TD$R)-1]
estimateRByDay <- as.data.frame(estimatedR) %>%
rename(R = estimatedR) %>%
mutate(day = row_number())
plot(estimateRByDay$day, estimateRByDay$R, xlab="days", ylab="R", type="l", main="Effective R")
abline(h=1, col="gray60")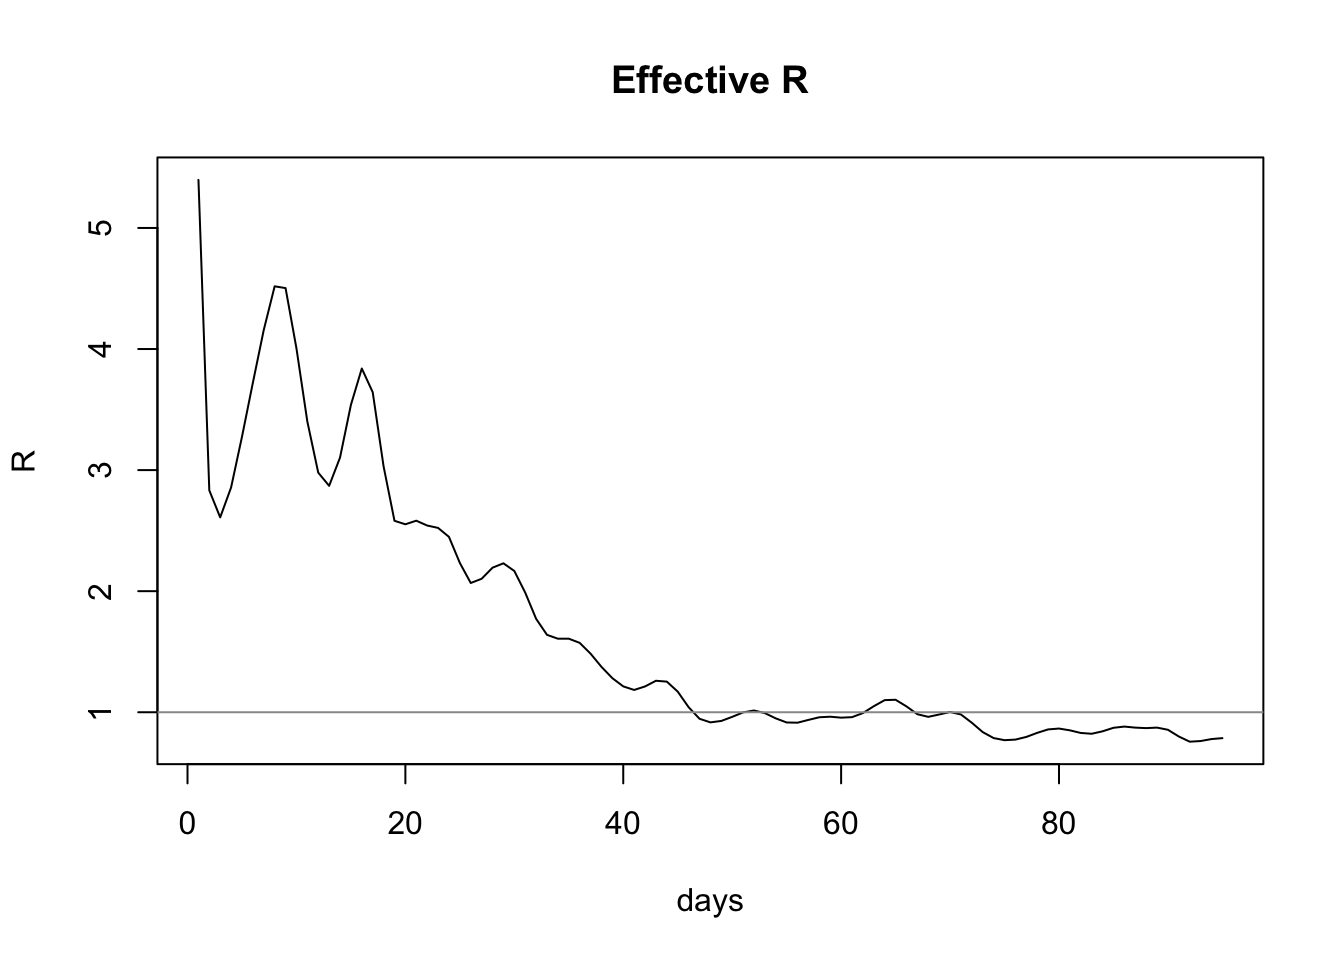
And thus we see the most recent value for effective R is 0.7860974, which is in agreement with the published value of R, which at the time of writing is given as 0.7-0.9.
I have since corrected the COVID-19 Explorer to use the correct calculation.
