
Herd Immunity
Note this post needs revision as the method of calculating R0, especially after the peak, is incorrect - see here for details
Herd immunity occurs when enough of the population, by one means or another, are immune to a disease, such that chains of infection are unlikely to occur. Acquiring that immunity can be via a vaccine, or through immunity acquired by an earlier infection.
We can define herd immunity in terms of R, the reproduction number, which is the number of people an individual infects in a population. This comes in two flavours:
- R0 - this is reproduction number when all members of the population are susceptible - “zero” immunity.
- Re - the effective reproduction number - this is the value of R at a particular point in time. R varies in reality as not all of the population is equally susceptible at any given time. For example, lockdowns can reduce R.
When R is above 1 then the infection spreads exponentially; when it is below 1 then the infection is likewise declining. The greater the fraction of the population that has become immune, the few potential people an individual can infect. The herd immunity threshold (hereafter abbreviated to HIT) is the minimum proportion of the population that must be immune such that R = 1. It can then be easily shown that HIT can be calculated as follows:
herdImmunityThreshold <- function(r) {
  1 - (1/r)
}
Let’s apply this to the situation in the UK. As per my previous post I’ll load and pre-process the data for the UK:
confirmed <- read.csv(url("https://raw.githubusercontent.com/CSSEGISandData/2019-nCoV/master/csse_covid_19_data/csse_covid_19_time_series/time_series_covid19_confirmed_global.csv"))
confirmed <- subset(confirmed, select = -c(Lat, Long))

ukConfirmed <- confirmed %>%
        filter(Country.Region == "United Kingdom")

sums <- colSums(ukConfirmed[,-match(c("Province.State", "Country.Region"), names(ukConfirmed))], na.rm=TRUE)
sumsByDateCode <- as.data.frame(t(t(sums)))
colnames(sumsByDateCode) <- c("count")
sumsByDateCode$datecode <- rownames(sumsByDateCode)
dailyCounts <-mutate(sumsByDateCode, date = mdy(substring(datecode, 2)))
dailyCounts$day <- seq.int(nrow(dailyCounts))
dailyCounts <- dailyCounts %>%
  filter(count > 0)
Use a mean generation time of 5 days with a standard deviation of 1.9 days:
meanGenerationTime <- generation.time("gamma", c(5, 1.9))Calculate the effective R values over time using the R0 package with the “time-dependent” method:
est <- estimate.R(dailyCounts$count, methods=c("TD"), GT=meanGenerationTime)As an illustration of how the herd immunity threshold (HIT) behaves as a function of R, let’s plot R and the equivalent HIT over time for the UK:
estDf <- as.data.frame(est$estimates$TD$R) %>%
  rename("R" = "est$estimates$TD$R") %>%
  mutate(day = row_number()) %>%
  mutate(hitPercent = herdImmunityThreshold(R) * 100)

scaleFactor <- max(estDf$R) / max(estDf$hitPercent)

ggplot() +
  geom_line(data = estDf, aes(x=day, y=R), color = "red") +
  geom_line(data = estDf, aes(x=day, y=hitPercent * scaleFactor), color = "blue") +
  scale_y_continuous(name="R", sec.axis=sec_axis(~./scaleFactor, name="HIT (%)")) +
  theme(
    axis.title.y.left=element_text(color="red"),
    axis.text.y.left=element_text(color="red"),
    axis.title.y.right=element_text(color="blue"),
    axis.text.y.right=element_text(color="blue")
  )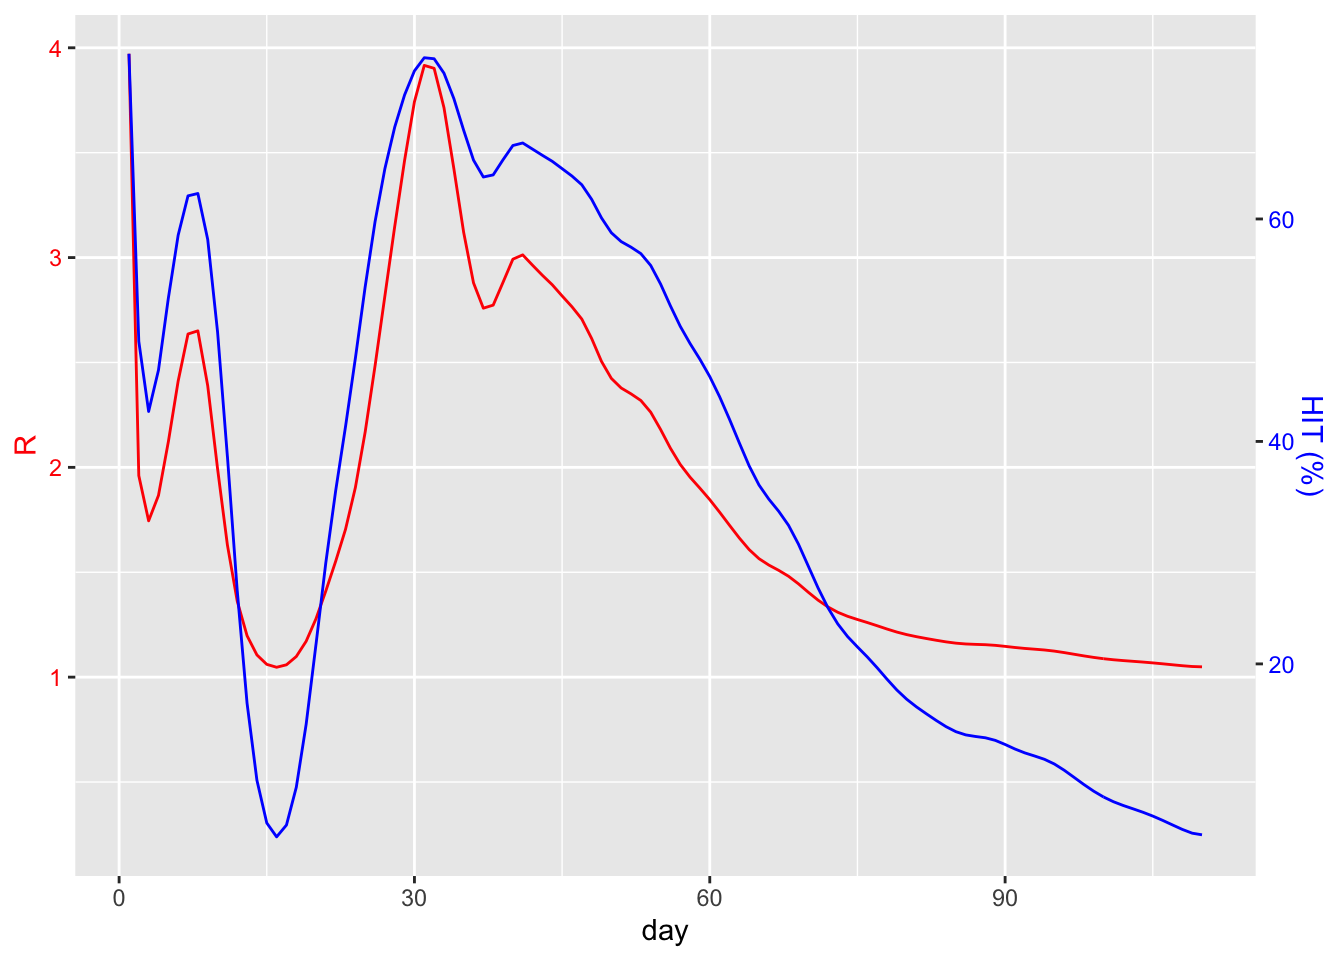
So right now (2020-07-22), it would seem that we would need at least 20% of the population to be immune for herd immunity to kick in. Unfortunately we’d be wrong.
The value of R shown here is the effective R number: it will reflect all the measures that we currently have in place. Social distancing, contact tracing, lockdowns and all the other features of the “new normal” have produced an R value of 1 or lower. So that 20% HIT would only be effective if we kept those measures in place! There’s also a likely second wave to consider. In practice, it’s even worse than that if we are considering a vaccine. The previous assumes that any vaccine is 100% effective. This is unlikely to be the case, and this will require a larger proportion of the population to be vaccinated.
Instead, we should consider the value of R as observed during the early stages of the outbreak, before any behavioural changes were made. From the graph above we might guess at a value roughly in the range of 2 to 4. This article refers to various studies which point to a mean R of 2.65. From this, we can calculate that 62.26% of the population would need to be immune. Again, this would probably need to be higher given the likelihood of a vaccine that’s not 100% effective.
If we are considering acquired immunity note that even with the 20% figure, if we are considering acquired immunity, then with (for the sake of argument) a case fatality rate of 1% in a population of 66.65 million this would mean well over 130k dead. For 66.26% the figure would be upward of 400k.
So, until a vaccine arrives we need to keep these measures in place, or develop new ones such as digital contact tracing (which itself relies on public trust in the government in order to “infect” enough people).
